
Point-in-Time Stock Analysis: The 5-Minute Check
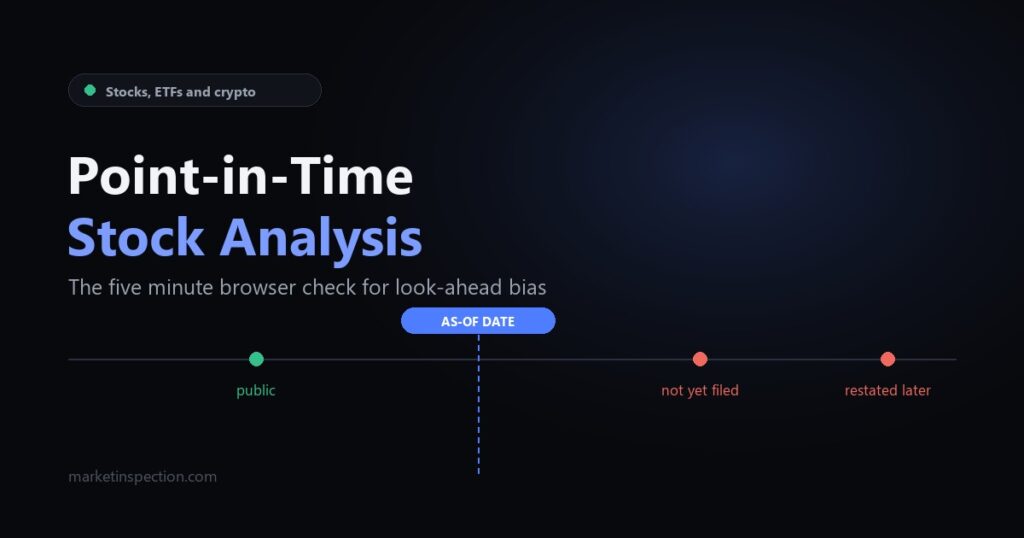
A point-in-time stock analysis is one that uses only the information
that was public on the date you picked, and you can verify whether a tool
actually does it in about five minutes, in your browser, without code or a
data subscription. Most retail tools never say whether they clamp
their data to your chosen date. This article shows the three checks that
reveal it, and answers a few related questions that keep coming up in
investing forums without a straight answer.
What you will be able to do after reading this
- Run three browser checks that expose future data leaking into a past date
- Tell the difference between a restated figure and an as-reported one
- Understand why an AI stock tool can give two different verdicts for the same ticker and date
- Read a coverage figure, and know when a rating was computed with a category missing
- Look up a non-US listing without guessing at the ticker
What is point-in-time stock analysis?
Point-in-time analysis answers a narrow question: what did the public record
say about this company on this date, and nothing later. The filing that
arrived two weeks afterwards does not count. Neither does the restatement
published the following year.
The distinction has a name in quantitative finance. Using information that
was not yet available at the moment you are modelling is called
look-ahead bias,
and it is the reason a backtest can look excellent and lose money in
production.
Institutional vendors sell point-in-time databases precisely because the
distinction is expensive to maintain. FactSet’s point-in-time fundamentals go
back to February 1999, and S&P Global’s Compustat snapshots begin in 1987.
Retail tools rarely mention the subject at all.
Why this matters even if you never backtest
You do not need to be running a strategy for this to bite you. Any time you
look back at a decision and ask “was that obvious at the time?”, you are
doing a point-in-time analysis, and the answer is worthless if the tool is
showing you figures that arrived later.
This is the most common way an investor convinces themselves they have an
edge. The signal looks clean in hindsight because hindsight is baked into the
data.
Why does a free stock tool show future data on a past date?
Usually not through malice, but through a default. The simplest way to build
a screener is to fetch the latest figures from a provider and display them
next to whatever date the user selected.
Fundamentals are the worst offenders, for two separate reasons.
First, there is the filing lag. A quarter ending 30 September is not public
until the 10-Q is filed, often six weeks later. A tool that attaches Q3
figures to 1 October is showing you something nobody could read for another
month and a half.
Second, there are restatements. When a company revises an earlier figure, most
commercial feeds replace the original quietly. The number you see for 2023 may
not be the number anyone saw in 2023.

How do I check a tool for look-ahead bias in my browser?
Every published method for this assumes you have a dataset with a filing-date
column and a backtesting framework around it. Here is the version you can run
on one ticker, in a browser, in five minutes.
Pick a company that filed a 10-Q in the last year. Any large-cap will do.
-
Find the real filing date. Open the company’s page on
SEC EDGAR
and note the acceptance date of the most recent 10-Q, not the period it
covers. Those two dates are usually four to seven weeks apart. -
Set the tool to the day before that filing date. Not the
period end. The day before the document became public. -
Look at the revenue or EPS figure the tool reports. If it
shows the quarter that had not yet been filed, the tool is leaking. If it
shows the previous quarter, it is clamping correctly.
The second check is for restatements, and it is slower but more revealing.
Find a company that restated a figure, set the tool to a date before the
restatement was published, and see which version it reports. Showing the
corrected number early is the subtler leak, and almost no retail tool survives
it.
The third check needs no filings at all. Set the date to a Saturday. A tool
that returns a fresh price for a weekend is not clamping anything, because
there was no close to report.
What I found when I ran these checks
Running the weekend test across a handful of free tools was the fastest
separator. Several returned Friday’s close silently relabelled as Saturday,
which is defensible, and two returned a live intraday price, which is not.
The filing-date test was harder to pass. Tools that pull from a single
aggregated feed almost always show the newest available quarter regardless of
the date in the picker, because the date only ever filtered the price chart.
Why does my AI stock tool give a different answer the second time?
Because large language models are not deterministic, even when you think you
have turned randomness off. A 2024 study of sentiment-analysis stability found
that GPT-4 and GPT-3.5-turbo
return non-deterministic responses at temperature 0,
and attributes it largely to sparse mixture-of-experts routing rather than to
sampling.
There are two further causes that have nothing to do with the model’s
internals. Hosted models are updated without notice, so the engine answering
you in March is not the engine that answered in January. And if the tool
fetches live prices before asking the model, the input genuinely changed
between runs.
This matters more than it sounds. If a verdict is not reproducible, you cannot
audit it, you cannot compare two dates honestly, and you cannot tell a change
in the company from a change in the dice.
What to do about it
Ask one question of any tool that gives you a rating: is the number arithmetic
over stated inputs, or is it a model’s opinion? Both are legitimate. Only the
first can be checked.
If the tool offers an AI layer, find out whether it writes the summary or
computes the score. A model that rewrites a finished analysis into readable
prose changes nothing about the verdict. A model that labels the inputs
changes the verdict itself, and that run is no longer reproducible.

What does it mean when a rating is missing a category?
Data sources fail. A filings endpoint rate-limits, a news feed returns
nothing, a ticker has no social following. The question is what the tool does
next.
There are three possible behaviours, and only one of them is honest. The tool
can score the missing category as neutral, which quietly drags every rating
towards hold. It can drop the category and renormalise the weights without
telling you. Or it can drop the category, renormalise, and show you that it
did.
That third behaviour is usually reported as a coverage figure. Coverage of
1.00 means every category reported. Coverage of 0.78 means roughly a fifth of
the intended evidence never arrived, and the verdict should be read with that
in mind.
“Nobody is talking about this company” and “we could not reach the server” are
different facts about the world. A tool that renders them identically is
throwing away the more useful one.
How do I analyse a stock that is not listed in the United States?
With a suffix. Most free data sources identify a non-US listing by appending
an exchange code to the ticker, so Shell on the London Stock Exchange is
SHEL.L and SAP on Xetra is SAP.DE.
This trips people up constantly, because the plain ticker often resolves to a
different instrument. SHEL on its own returns the New York ADR, which has a
different price, a different currency, and a different liquidity profile.
Class shares use a dot too, which is where it gets confusing. BRK.B is a share
class, not an exchange, and it stays as it is.
How do I run a point-in-time stock analysis myself?
This is the whole procedure, start to finish, on one ticker.
- Open EDGAR and note the acceptance date of a company’s latest 10-Q
- Open your analysis tool and set the as-of date to the day before it
- Compare the reported quarter against what was public on that day
- Repeat with the as-of date set to a Saturday
- Run the same ticker and date twice, and check whether the verdict is identical
- Note the coverage figure, if the tool gives you one
A tool that passes all four tests is giving you a point-in-time stock analysis.
A tool that fails the first is giving you today’s data with a date picker
attached.
Where MarketInspection fits
MarketInspection is a Chrome side panel that runs a point-in-time stock analysis
on any stock, ETF or cryptocurrency, and it was built around the constraints above.
Every vendor result is clamped to the as-of date in your browser rather than
trusting a vendor parameter, the report names which source each reading came
from, and the coverage figure is on screen rather than buried.
The rating itself is arithmetic over stated readings, so the same ticker on the
same date gives the same verdict. The AI write-up is optional and off by
default, and the settings page says plainly which of its two modes affects the
score and which only affects the prose.
Summary
| Question | Short answer |
|---|---|
| What is a point-in-time stock analysis? | One that uses only information public on the chosen date |
| How do I test a tool for leaks? | Set the date to the day before a 10-Q filing and check the reported quarter |
| Fastest single test? | Set the as-of date to a Saturday and see what price comes back |
| Why do two runs disagree? | Language models are non-deterministic even at temperature 0 |
| What does coverage mean? | The share of intended evidence that actually arrived |
| How do I query a London listing? | Add the exchange suffix, as in SHEL.L |
None of this makes a verdict correct. It makes a verdict checkable, which is
the only property you can actually verify before you risk money on it.
MarketInspection is a research tool and not investment advice. See the
privacy policy for what the extension sends and
stores, and the terms of service for what a rating is
and is not.